
StoryMap - Assessing transit suitability in SLCo
Note: This post replicates a StoryMap created for a group project in case it becomes inaccessible at some point in the future. Plus, I wanted to learn how to embed HTML maps in Jekyll, which turned out to be quite easy - you can add an iframe that embeds an HTML map stored elsewhere in the repo. The HTML below came from Rob Williams (the next step is learning to do this through R Markdown).
<iframe src="/files/html/FILE-NAME.html" height="600px" width="100%"
        style="border:none;"></iframe>
Background
Salt Lake County’s population is projected to grow by almost 500,000 – or 41% – over the next 40 years (Hollingshaus et al, 2022). If development patterns remain similar, much of this growth will occur outside of existing urban centers and sprawl across the entire Salt Lake Valley. As urbanization happens, the number of trips taken, distance traveled, and demand for transit services increases. Recent calls for equitable and sustainable planning have shifted the focus of some transportation authorities from reducing congestion to reducing vehicle miles traveled. Barring changes in land use and mix, this is usually accomplished by providing effective and efficient public transit systems.
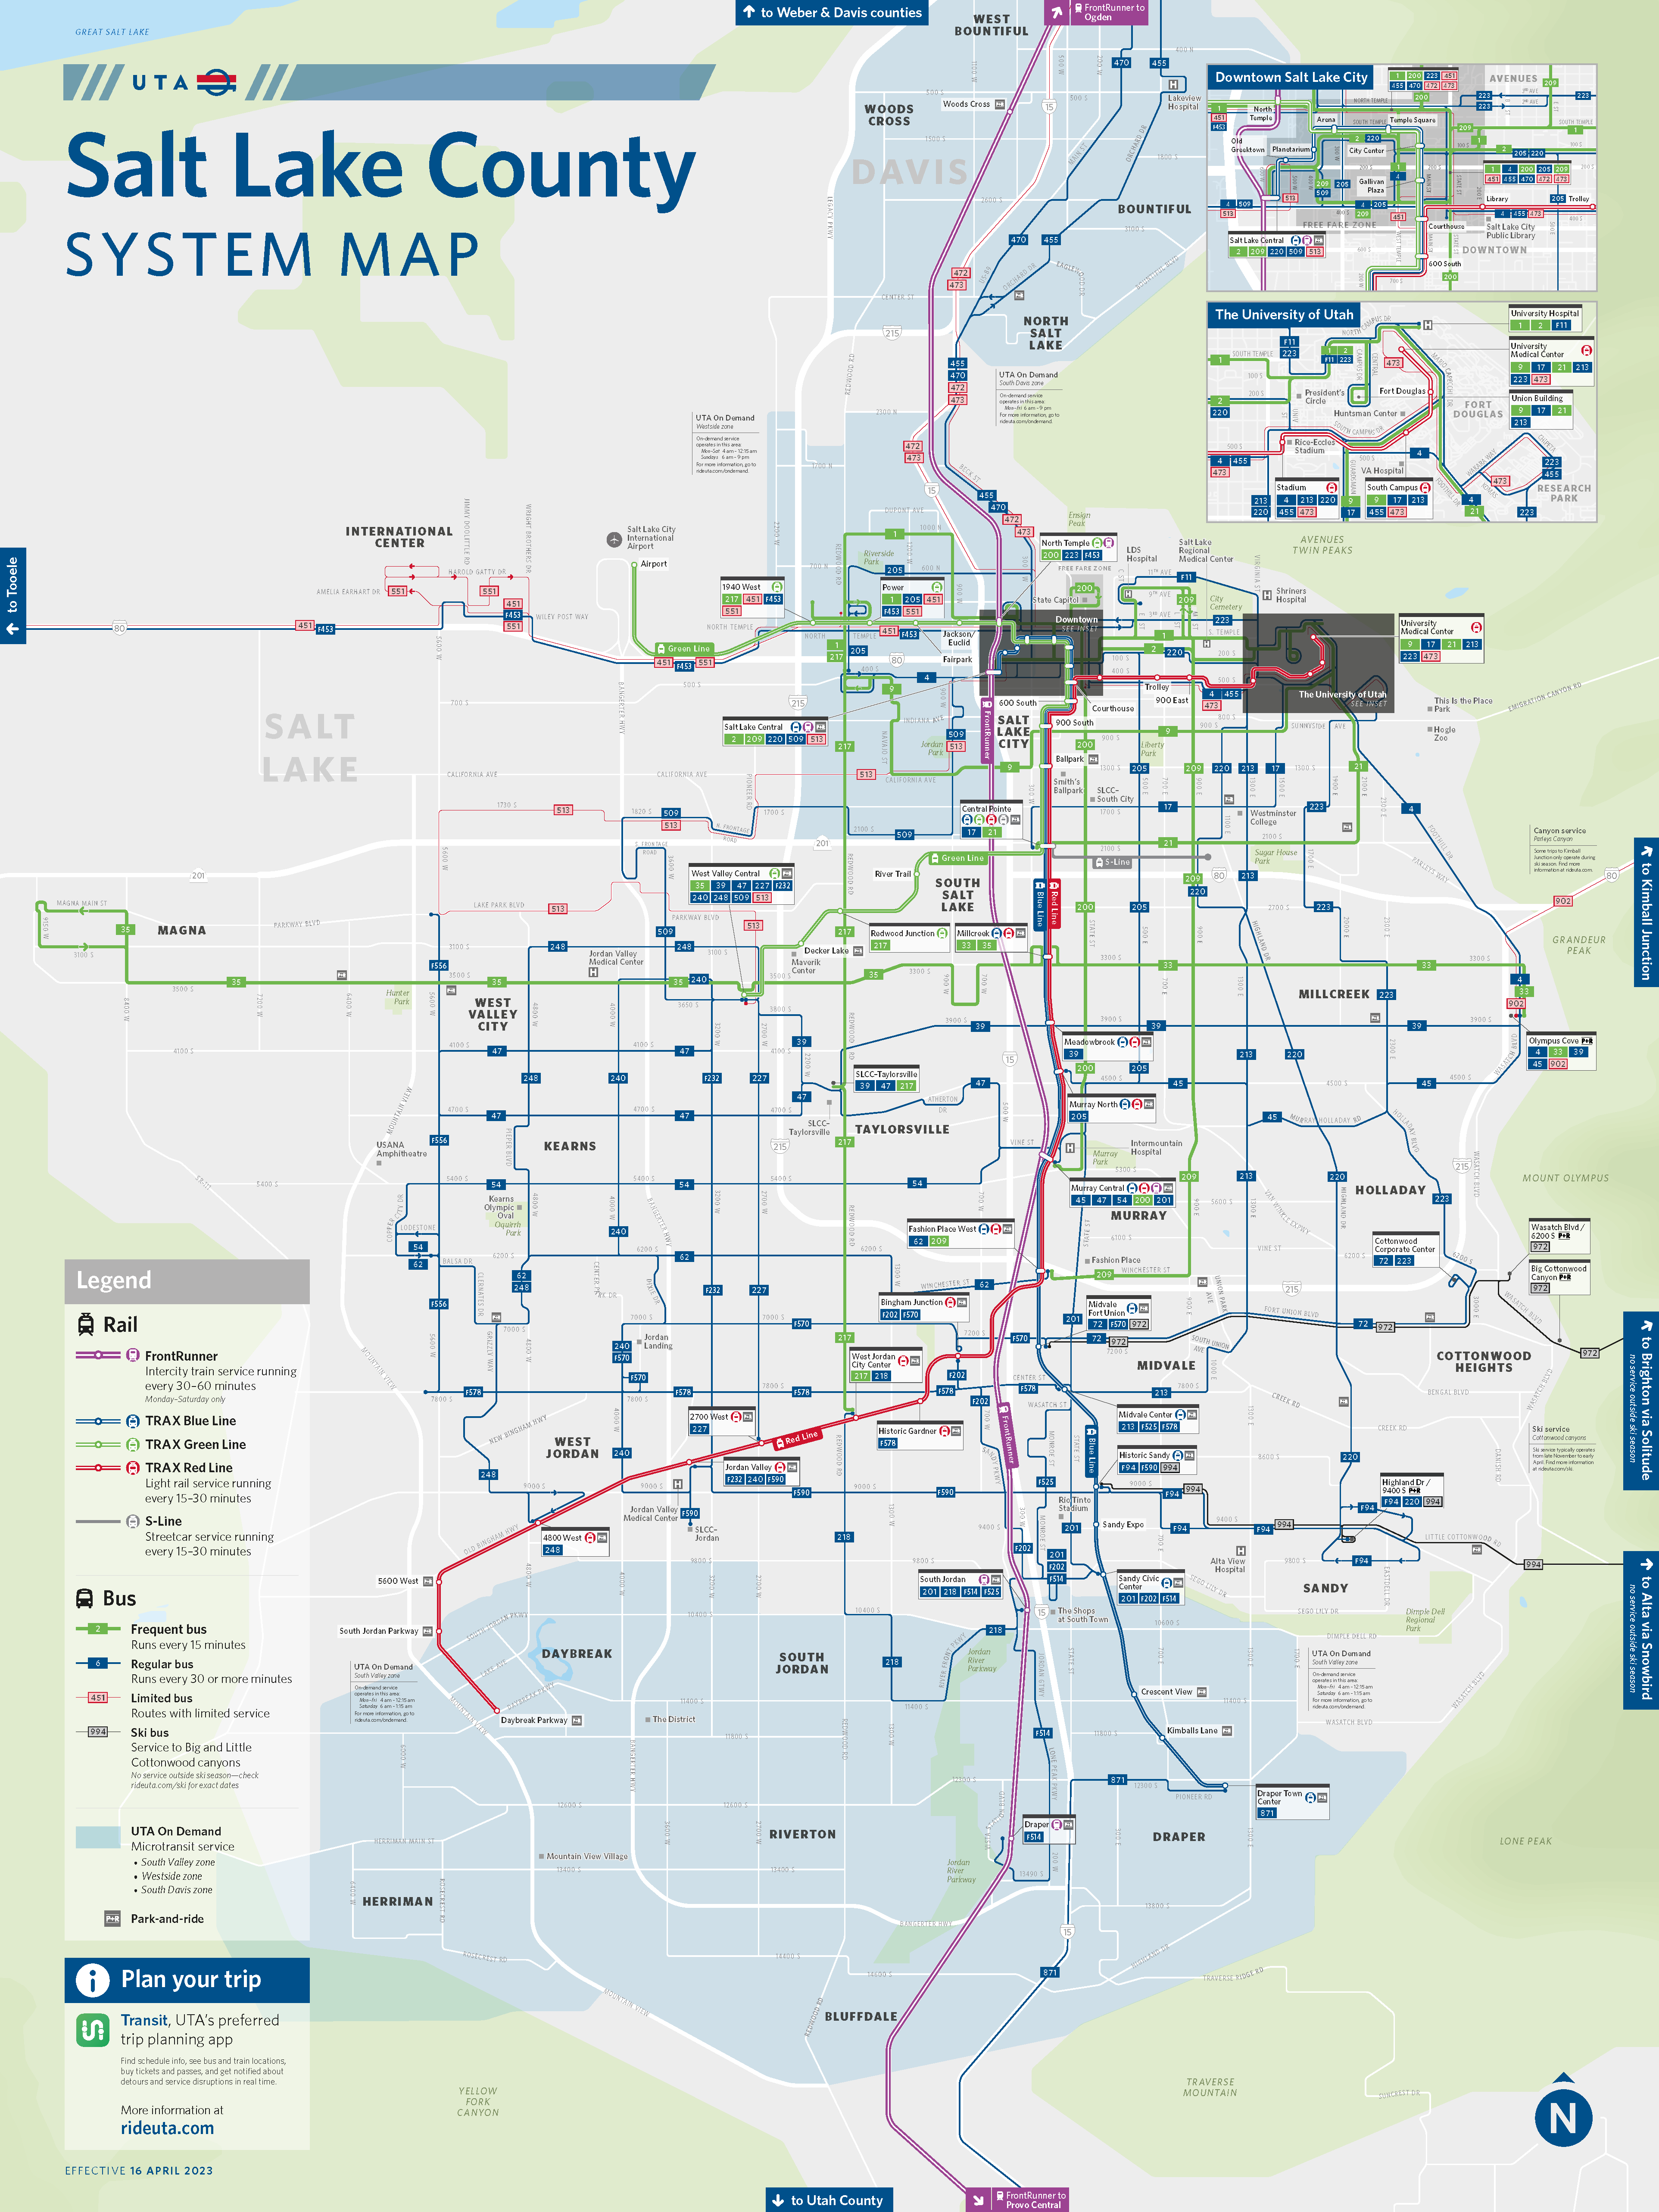
Salt Lake County’s transit network is concentrated within Salt Lake City and primarily serves the downtown area and the University of Utah. Service is available but limited in the western and central parts of the county and there is little to no service in the southern parts of the county. While there may not be strong demand for transit right now, demand will likely increase over the next decade as development continues and low-income households – who are more likely to rely on transit – are displaced outside of the existing network by rising rents (Davidson, 2020).
Our goal is to determine which areas of Salt Lake County are most suitable for bus service, including places with existing service that may not be optimal. We seek to answer the following questions: How does the existing bus network align with current conditions? Where should the Utah Transit Authority (UTA) consider expanding their bus network?
Variables
We completed a suitability analysis based on five population variables, one destination variable, and existing access to public transit. Our analysis was informed by a UTA report on ridership versus coverage and similar analyses in Omaha and Atlanta.
When planning for transit service, agencies should consider populations – particularly racial minority, low-income, and other disadvantaged populations – that are more likely to be dependent on public transit and would be affected by inadequate or no transit service. Because of this, we considered six variables based on existing research and best practices around service planning. These variables are low-income, senior, non-white, and no vehicle populations; population density, and job density.
According to the Federal Highway Administration, low-income individuals are more likely to rely on transit and spend a higher proportion of their income on transportation and housing expenses. Low-income individuals make about three times as many transit trips as higher-income individuals (FHWA, 2014). Additionally, there is a large spatial mismatch between low-income households and jobs, since low-income households are more likely to live in suburban areas and commute to central business districts for work using transit (Urban Institute, 2020; Sugie & Lens, 2017). Racial minorities have less access to safe and affordable transportation as well (Urban Institute, 2020).
Many seniors need affordable alternatives to driving to maintain their independence as they age and they lose the ability to drive (Degood, 2011). Lack of access to transit can isolate seniors, reduce their quality of life, and expose them to economic hardships (Shrestha et al, 2016). We also considered households without vehicles, since they would naturally rely on public transit or walking and biking. Finally, we included population and job density since they are inherent determinants of potential ridership.
We used data from the American Community Survey (ACS) for demographic variables, which were reported at the block group level using five-year estimates from 2017-2021. For job density, we used employee count data from the Longitudinal Household-Employer Dynamics (LEHD) program, which was reported at the block level for 2019. We used transit stop and route data provided through the Utah Geospatial Resource Center (UGRC) for the accessibility analysis and final visualizations.
Weighting
Our primary analysis weights were based on a study done by MetroNext in Omaha. Although not every variable used in their analysis was used in our own, there was a strong overlap between the two. Differences begin to show with the built environment portion of their variables, which we did not include; these weights were shifted to our other variable groups.
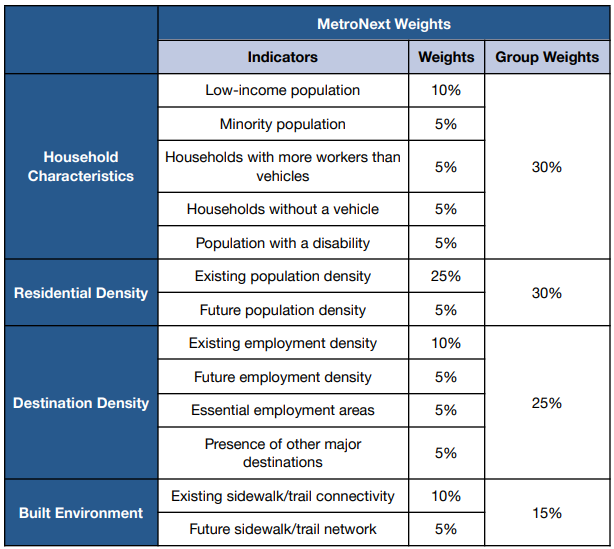
Another important difference to note is the lack of future population weights included in our analysis. We felt it was less important since the MetroNext study involved all forms of transit, while our study was entirely focused on buses. Bus routes have minimal build-outs and changes to infrastructure and are easily adjustable when compared to other forms of transit. Because of this, we felt it wasn’t necessary to try to predict population and job center changes over time.
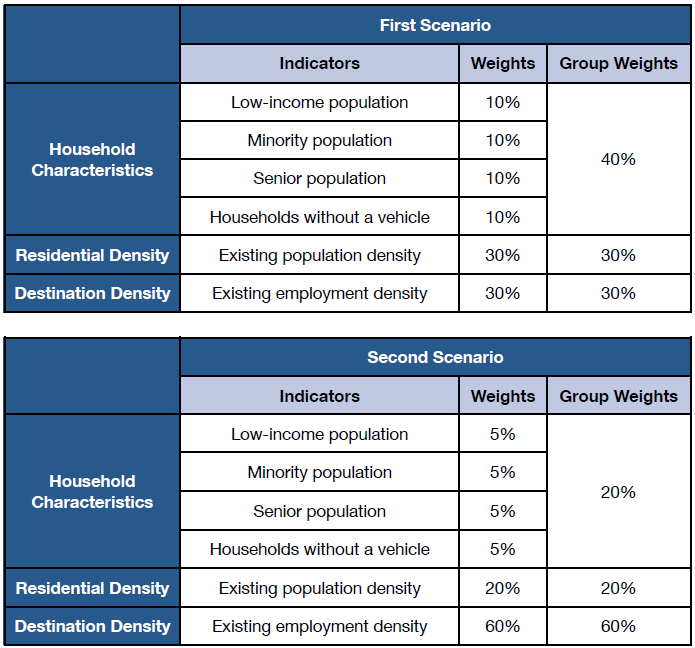
While it was important for us to initially model our study on an established report, we wanted to include another model that would test for sensitivity in the model and emphasize ridership (population and job weights) rather than equity and demographics.
Methodology
The suitability and accessibility analyses were completed in R and a diagram of our generalized workflow is shown below.
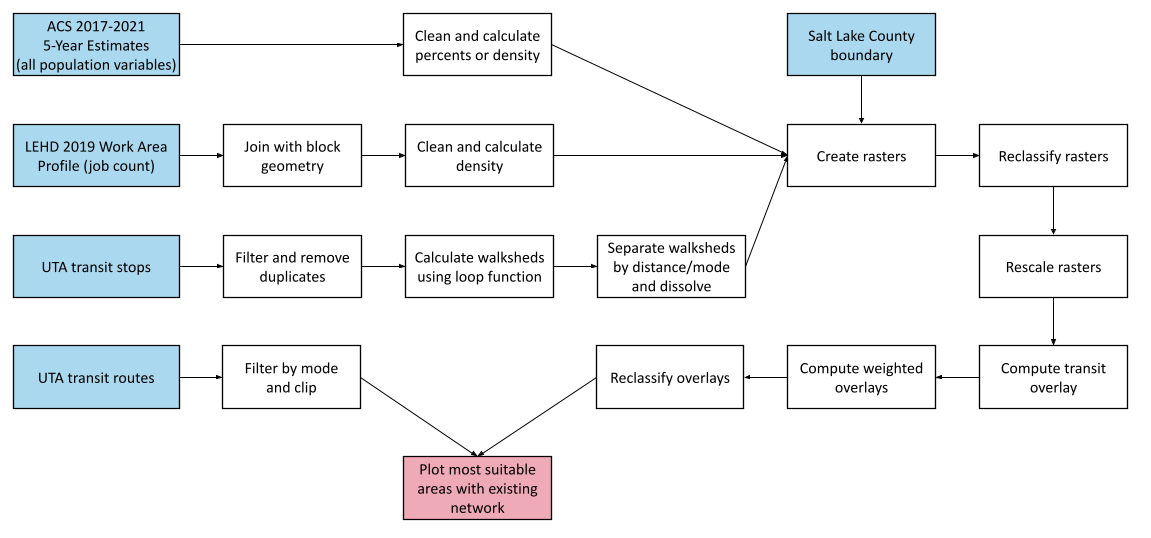
We began by querying demographic estimates through the Census Bureau’s API, cleaning the outputs, and calculating the derived variables. We used the Census Bureau’s OnTheMap tool to download the job data, which we read into R and joined with block boundaries queried from the Census Bureau. Densities were calculated using the polygon areas and reported as people or jobs per square meter. Additionally, we replaced NA or NaN values with 0 to avoid empty pixels after the raster overlay and transformed the objects to EPSG 3566.
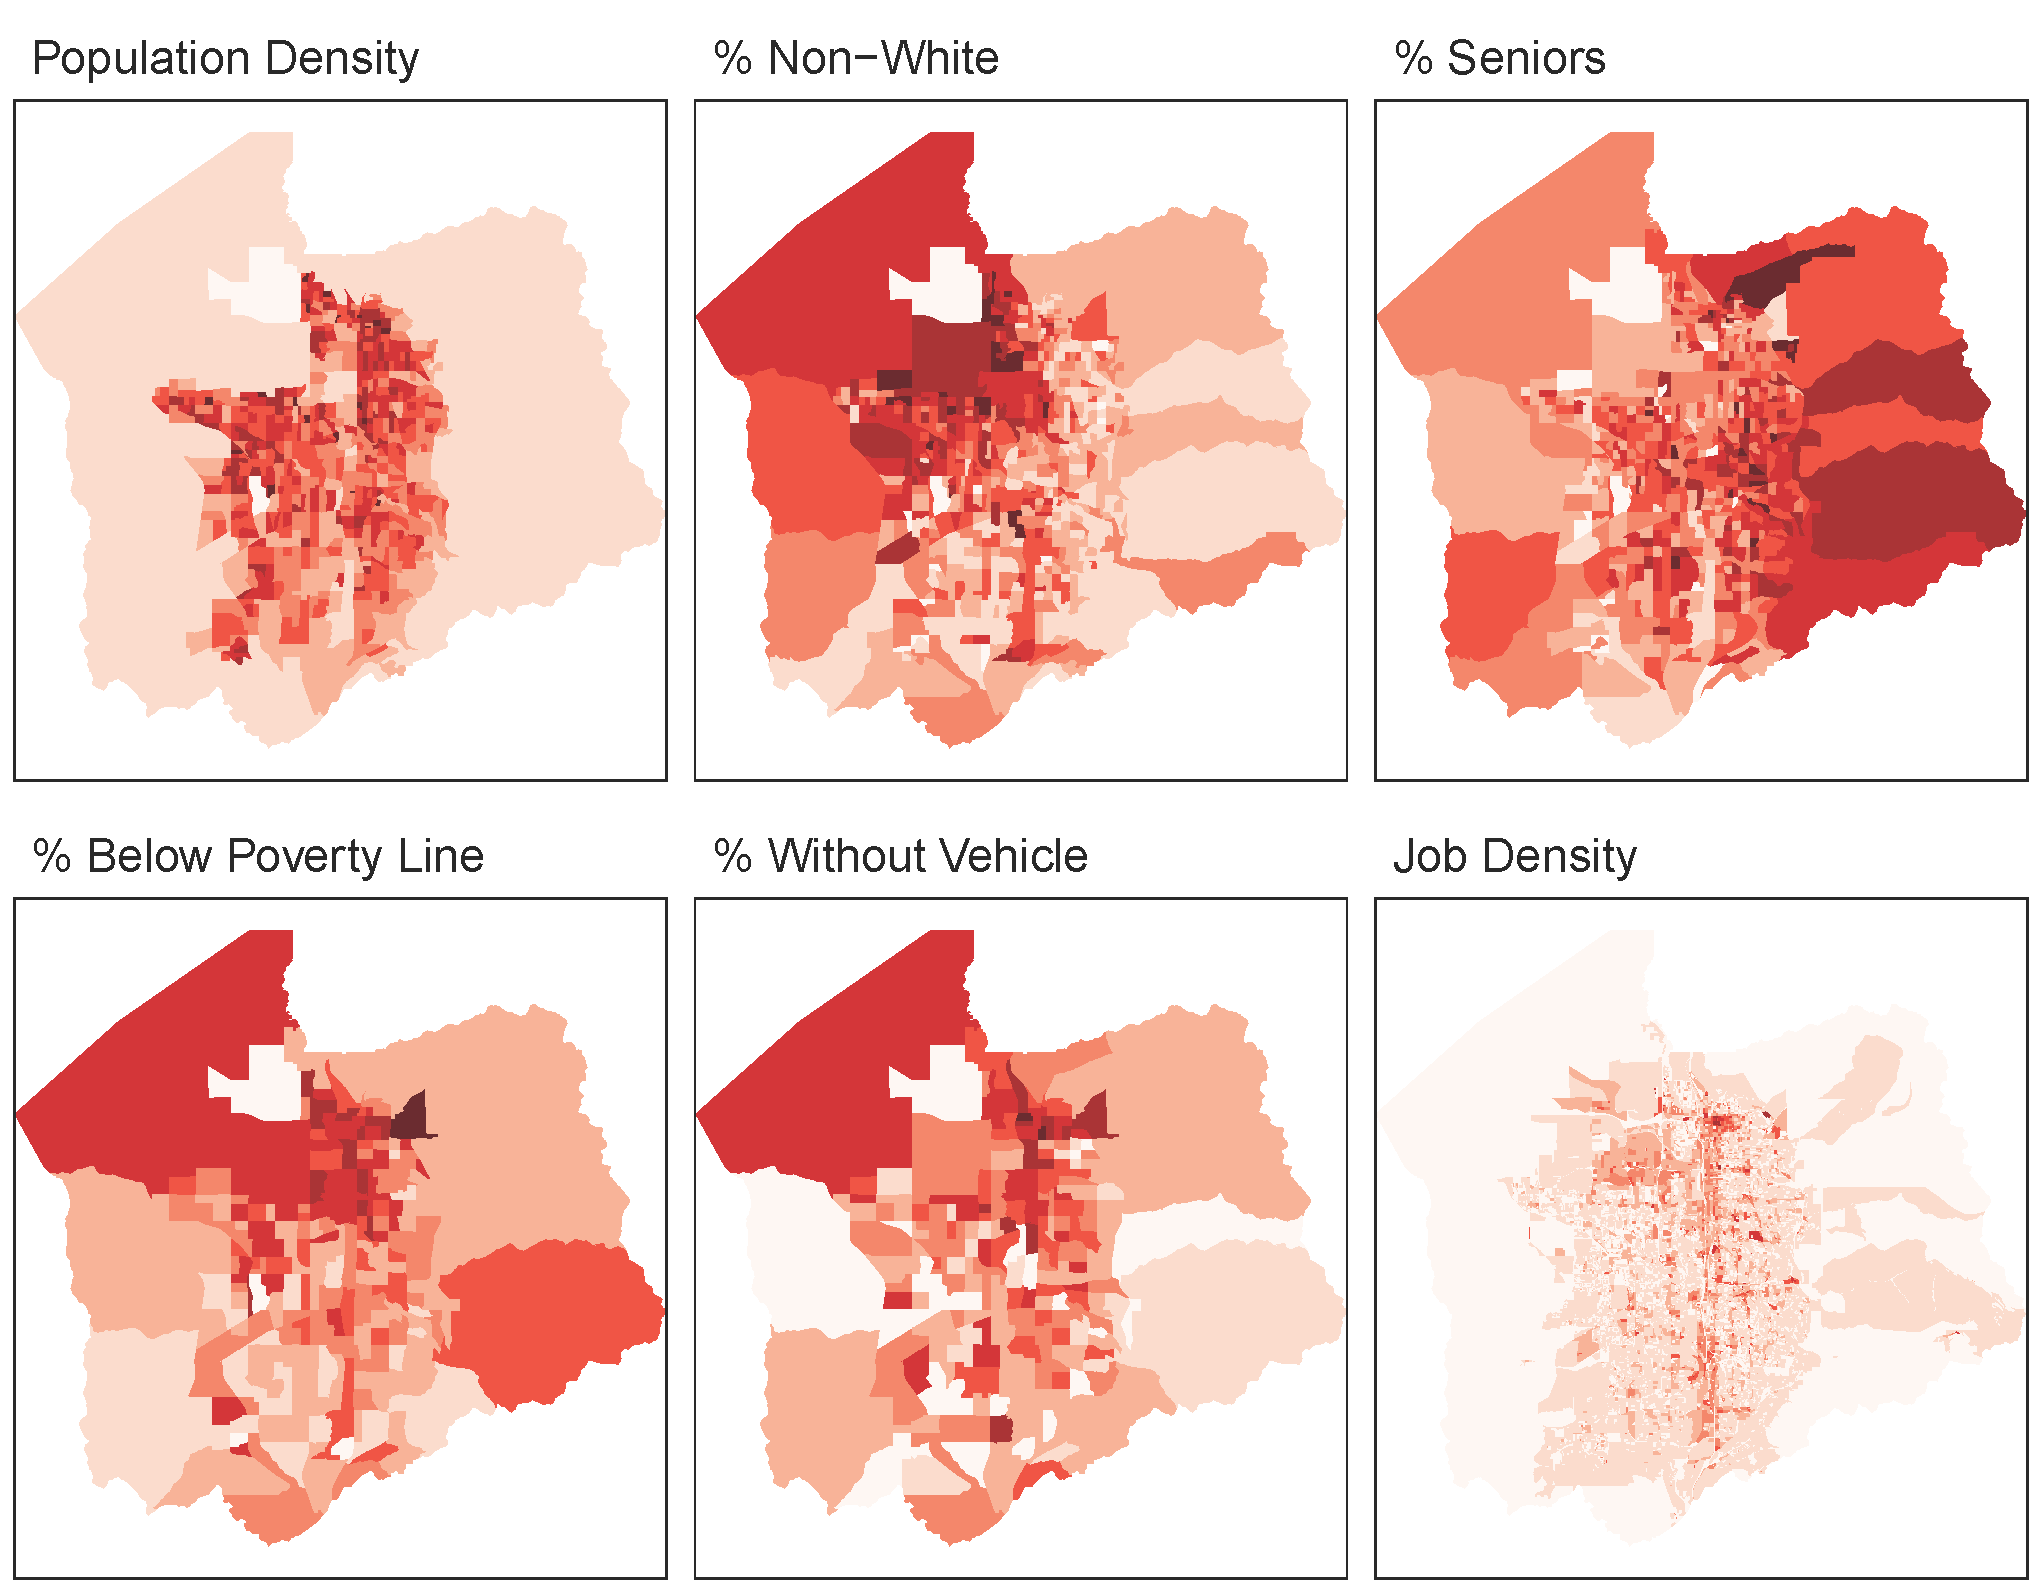
Next, we created rasters for each of the six variables using the Salt Lake County boundary as the extent and a resolution of 300; the initial rasters are shown below.
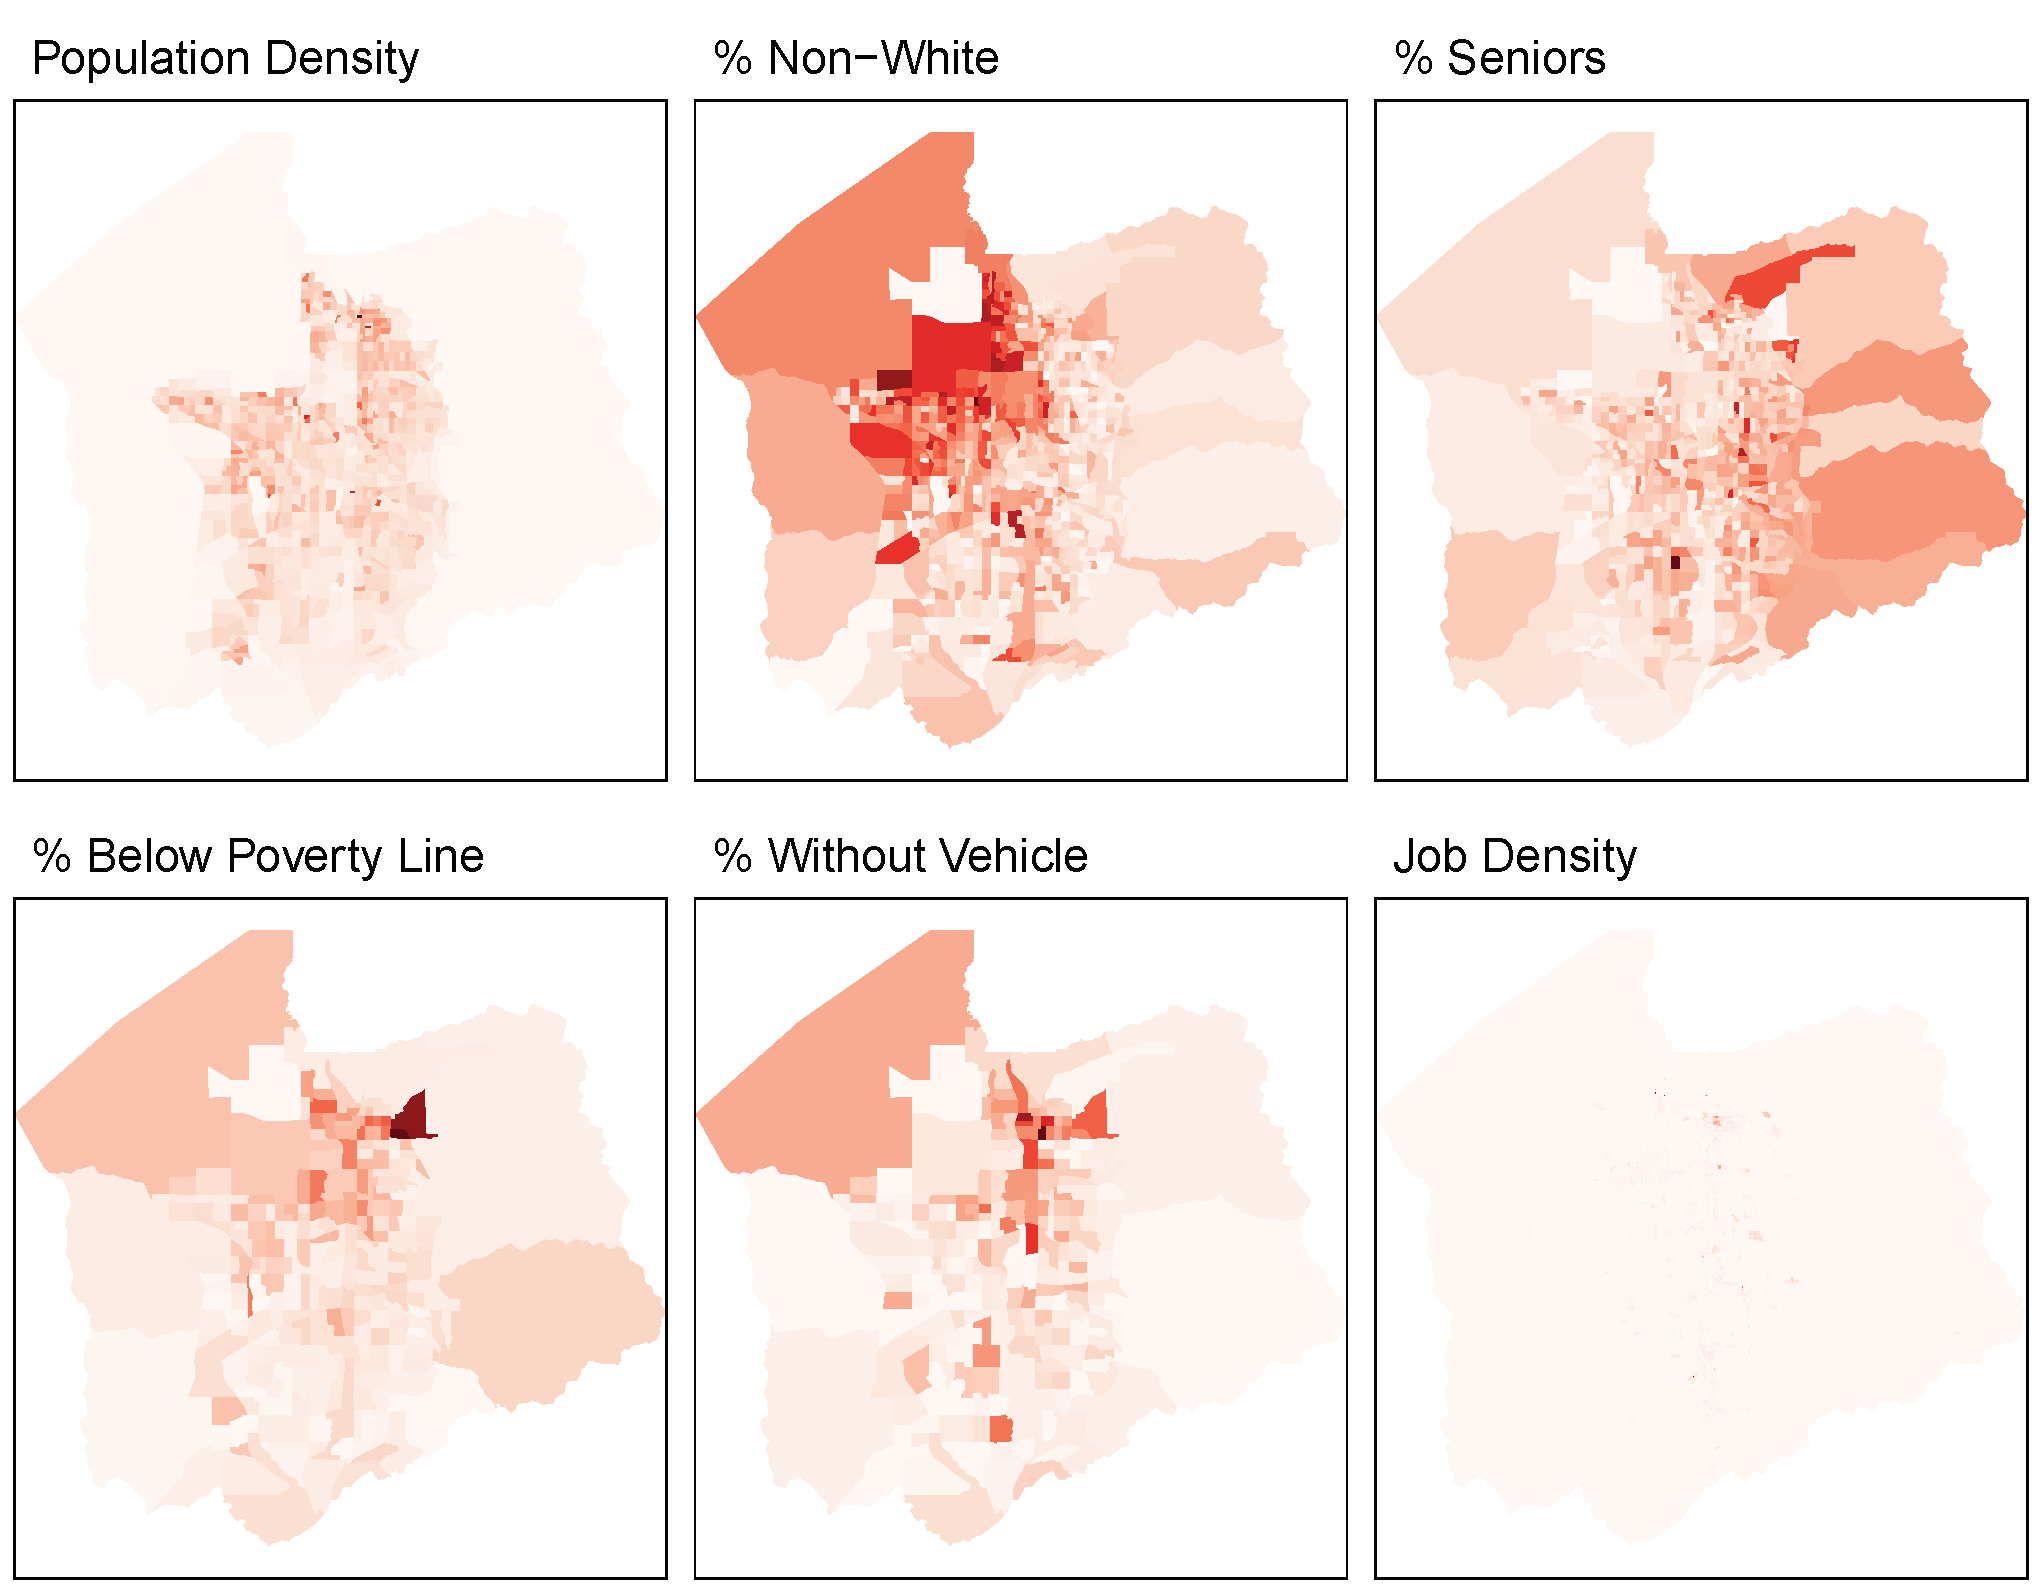
Given the distribution of values – especially for job density, which is barely visible – we decided to reclassify each raster using the Fisher method with seven breaks, which is similar to the Jenks method but faster for large datasets. Finally, we rescaled the rasters to 0-1 scale using min-max normalization.
An interactive map is shown below. (Note: The layers are transparent to allow for easier navigation around the county, so only one layer should be selected at once.)
For the accessibility analysis, we downloaded transit stop data from the UGRC, filtered for Salt Lake County, and removed duplicate stops. Using stop coordinates and an API from Openrouteservice, we calculated 5-, 10-, and 15-minute walksheds from each stop. Since there are over 3,000 transit stops in Salt Lake County, we used a loop function over the course of a week to avoid API call limits. After transforming the walksheds to EPSG 3566 and separating them by stop type (bus or rail) and walkshed distance, we dissolved each object to create a simplified walkshed and added a dummy variable to use during rasterization. Finally, we rasterized each simplified object and replaced NA values with 0 to avoid empty pixels after the raster overlay.
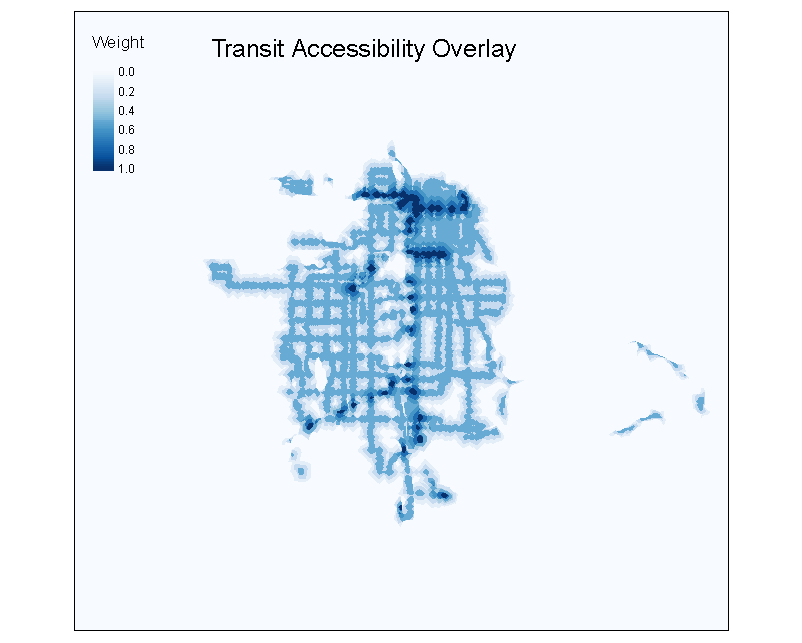
To simplify the suitability analysis, we began by creating a single transit accessibility overlay (shown below) based on the six walkshed rasters. The 5-minute bus and rail walksheds were each given a 25% weight, while the 10- and 15-minute bus and rail walksheds were each given weights of 15% and 10%, respectively.
Finally, we calculated two weighted overlays based on the weights described earlier: one which incorporates existing access to transit as a negative factor and one which does not include access. When visualizing the results, we decided to show only the most suitable areas, or those with the highest values. Values in the 95th percentile or higher are shown as “Most suitable” (dark blue), while values in the 90th percentile are shown as “Suitable” (light blue). The results of our primary analysis are shown below (the full overlay is available on GitHub).
Findings
After accounting for the existing transit network, we can clearly see which parts of Salt Lake County would benefit from expanded bus service. As expected, these areas are concentrated in the southern part of the county and include large portions of Herriman, South Jordan, Riverton, and White City. Outside of Salt Lake City, the bus network primarily follows major roadways, which results in service gaps in South Salt Lake, West Valley City, and Murray.
Our analysis highlights several other areas that may be underserved by the existing network, including Rose Park, Jordan Meadows, Magna, and the industrial districts near the airport. Additionally, while the east-west divide is not quite as pronounced in this analysis, it is still apparent when comparing neighborhoods in the Sugar House and Mt. Olympus areas to the rest of the county.
UTA recently published a 2023-2027 Service Plan, which describes their vision for potential service changes over the next five years. Few changes are proposed for Salt Lake County, and most involve minor adjustments to existing routes. The plan does describe some visionary but longer-term changes, including an expansion of on-demand service in West Jordan, Cottonwood Heights, and Herriman. Additionally, UTA is proposing a flex route (Route F126) between Draper and Daybreak and an extension of Route 248 through West Jordan to Daybreak. These changes would address some service gaps, but our analysis suggests that Route 248 should be shifted from 4800 W to 4000 W until Daybreak is fully built out.
In our secondary analysis, we modified the variable weights to deprioritize population characteristics and emphasize job density, since employment is a major driver of economic growth. In this scenario, job density received a weight of 60%, population density received a weight of 20%, and household characteristics received weights of 5% each. The results of this secondary analysis are shown below (the full overlay is available on GitHub).
In this scenario, there is a substantial decrease in suitability throughout the western part of Salt Lake County, with the exception of the industrial districts near the airport. They are slightly more suitable, specifically near Glendale. This decrease is balanced out by a clear increase in suitability throughout the entire southern part of the county, especially between Herriman and Riverton along Bangerter Highway and along the I-15 corridor.
Challenges and Limitations
We encountered several challenges in working with spatial data. Census data is both an estimation and an aggregation, since fewer than 3% of households participate in the ACS and data is reported for defined areas. The modifiable areal unit problem indicates that aggregating data by arbitrary units can impact the observed patterns. We addressed this by using the smallest possible unit for each variable. Salt Lake County’s geography introduces a second challenge, since some census units include large swaths of almost uninhabited land in the Wasatch and Oquirrh mountain ranges. We addressed this by using densities or percentages, rather than counts.
Our analysis was limited by several methodological factors as well. First, we used a limited set of variables that we felt best represented the expected need for transit service given the resources available. Future analyses could include more and/or different variables based on a more extensive literature review, especially destination-related variables. Second, we only used current data and did not incorporate any projections. Since Salt Lake County is expanding rapidly, incorporating household and job projections would provide a more accurate understanding of future conditions.
Moving Forward
Our analysis finds that several communities in southern Salt Lake County – including Herriman, South Jordan, and Riverton – would be suitable for expanded bus service based on population and destination characteristics. It is important to remember that the region’s highly suburban nature would make any expansion challenging. Even though an area may be considered suitable for transit based on household and destination characteristics, it may not have the overall density or mix of land uses necessary to support bus service. That being said, rapid growth and urbanization over the next several decades will force some degree of action as congestion becomes increasingly unmanageable through single-occupancy vehicle infrastructure alone.
If we were to continue this analysis, the next step would involve determining specific corridors for expanded service. The weighted values we generated could potentially be used to create specific routes using a least-cost path analysis constrained by the existing road network. Additionally, UTA is developing a long-range transit plan for release this fall. When their plan is released, we would be able to compare any proposed expansions with the high suitability areas identified in our own analysis.
References
ATL. (2021). Transit network analysis: 2022 ATL regional transit plan. https://atltransit.ga.gov/wp-content/uploads/2021/12/ARTP_Network-Analysis-Summary-Report_FINAL.pdf
Davidson, Lee. (2020, April 20). Lower income Utahns, young people and students make up most of UTA’s ridership. The Salt Lake Tribune. https://www.sltrib.com/news/politics/2020/04/30/lower-income-utahns-young
Degood, K. (2011). Aging in Place, Stuck Without Options. Transportation for America. https://t4america.org/docs/SeniorsMobilityCrisis.pdf
FHWA. (2014). Mobility challenges for households in poverty. https://nhts.ornl.gov/briefs/PovertyBrief.pdf
Hollingshaus, R., Hogue, M., Harris, E., Bateman, M., Backlund, M., Albers, E. (2022). Utah long-term planning projections. Kem C. Gardner Policy Institute. https://gardner.utah.edu/wp-content/uploads/LongTermProj-Jan2022.pdf?x71849&x71849
Metro. (2022). Transit suitability index. https://www.ometro.com/wp-content/uploads/2020/09/A.-Transit-Suitability-Index.pdf
Shrestha, B. P., Millonig, A., Hounsell, N. B., McDonald, M. (2016). Review of Public Transport Needs of Older People in European Context. Journal of Population Ageing, 10, 343-361. https://link.springer.com/article/10.1007/s12062-016-9168-9
Sugie, N. F., Lens, M. C. (2017). Daytime Locations in Spatial Mismatch: Job Accessibility and Employment at Reentry From Prison. Demography, 54(2), 775-800. https://doi.org/10.1007/s13524-017-0549-3
Urban Institute. (2020, October 7). The unequal commute. https://www.urban.org/features/unequal-commute
UTA. (2019). Service choices report. Jarrett Walker + Associates. https://rideuta.com/-/media/Files/About-UTA/Service-Choices/Service_Choices_UTA_Choices_Report_20190122b.ashx
Data Sources
United States Census Bureau. (2023). American Community Survey [Data set]. https://www.census.gov/programs-surveys/acs
United States Census Bureau. (2023). Longitudinal Employer-Household Dynamics [Data set]. https://lehd.ces.census.gov/
United States Census Bureau. (2023). TIGER/Line Shapefiles [Data set]. https://www.census.gov/geographies/mapping-files/time-series/geo/tiger-line-file.html
Utah Geospatial Resource Center. (2023). Bus, Commuter, and Light Rail [Data set]. https://gis.utah.gov/data/transportation/transit/