
Incorporating growth projections into a transit suitability analysis
Earlier this year, I worked on a transit suitability analysis of Salt Lake County as part of a graduate course on spatial data (context for the project). There were three main limitations to our analysis:
- We used a limited set of variables that may not perfectly represent transit need and demand.
- We didn’t account for non-employment destinations or activity centers.
- We didn’t incorporate any type of growth projection.
The first limitation is inherent to this type of analysis. You could make a strong argument that the second limitation is the most critical since we travel with a specific destination in mind. However, our analysis was focused on places with little or no transit service and our assumption was that adding more destination variables would mostly favor places with existing service, like downtown or city centers. Addressing this limitation would be more important when defining specific routes and stops.
The third limitation is the most interesting, especially when you think about what the valley will look like in 2050. Utah is growing rapidly, and Salt Lake County is projected to grow by 41%, or almost 500,000 people, over the next 40 years. Our analysis ignored this growth since we were concerned with existing gaps in bus service, which doesn’t require much fixed infrastructure and is easily adjustable compared to other forms of transit.

That being said, it’s still important for planners to think about what transit service might look like in a few decades – so much so that UTA is working on their first long-range service plan, something that’s usually handled by a metropolitan planning organization. It’s better to start planning early since transportation and land use go hand in hand – establishing strong transit corridors could, and should, facilitate more targeted growth. Plus, transit projects in the United States take longer to complete than projects in other counties.
Projecting growth:
It’s easy to incorporate growth as a variable, but actually projecting it is the hard part. Fortunately, the Wasatch Front Regional Council forecasts socioeconomic growth across the entire state as part of their regional transportation planning process and provides this data to the public. In Salt Lake County, the Wasatch Front Real Estate Market Model (REMM) takes county-level projections from the Gardner Policy Institute and land use data to project growth by traffic analysis zones, or TAZs, which are the building blocks of traditional travel models.
TAZs have unique boundaries, but they’re analogous to census block groups in terms of size and type of boundary (e.g., major roads). There are 1,146 TAZs in Salt Lake County, compared to 251 census tracts, 712 census block groups, and 7,136 census blocks. For this analysis, I’ll be using population and job projections for 2050.
Visualizing growth:
Before incorporating the projections, I wanted to see what REMM forecasted over the next 30 years. The static map below shows population and job densities in 2019 and 2050, while the interactive map shows changes in counts and densities. (Note: The layers are transparent to allow for easier navigation around the county, so only one layer should be selected at once.)
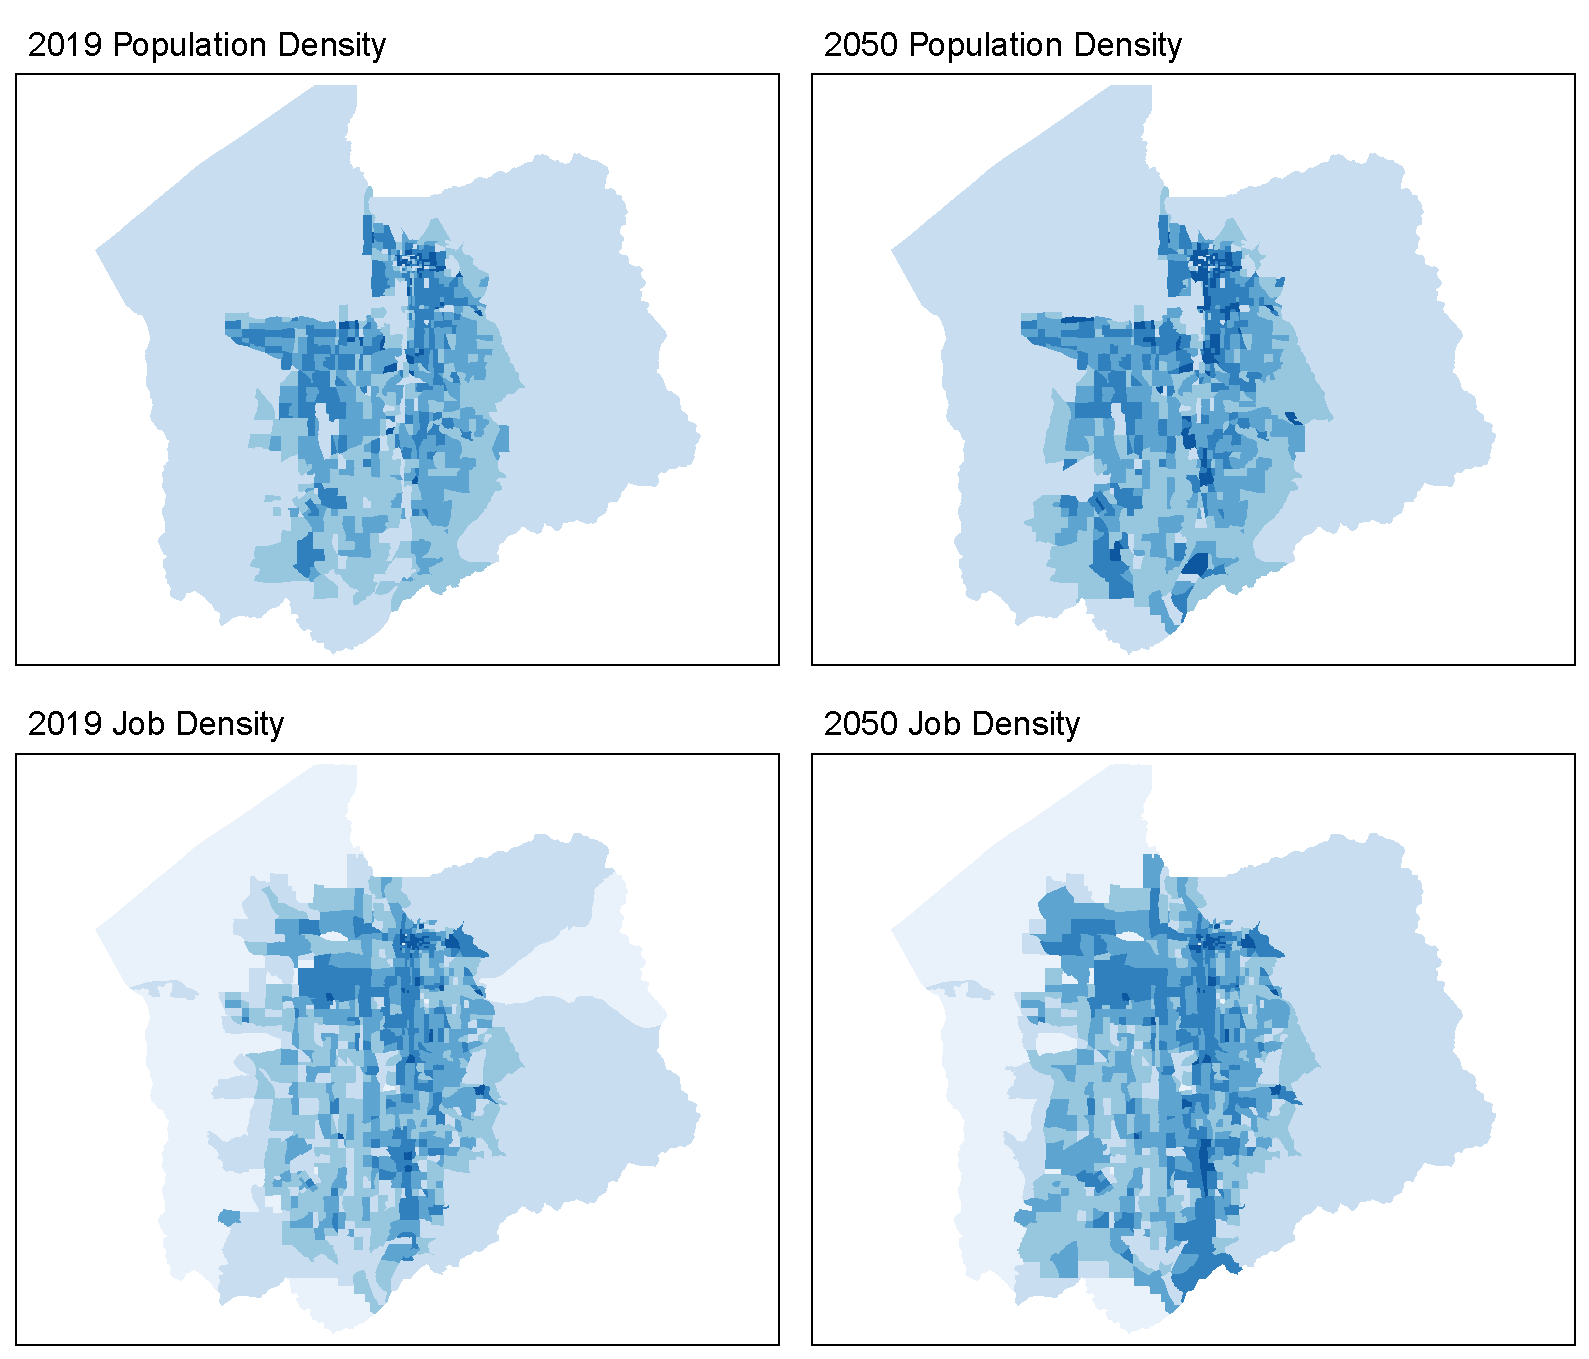
I manually set the breaks as roughly the 0th, 5th, 25th, 50th, 75th, 95th, and 100th percentiles to account for outliers. Density is calculated as people per acre. For reference, you can build about five single family homes or 15 townhomes on a single acre; this equates to about 12 people or 40 people per acre, respectively, assuming an average household size of 2.5 people.
As expected, undeveloped or underdeveloped TAZs will likely grow significantly. These are places like Daybreak, Herriman, and other communities along the Mountain View Corridor – not to mention the redevelopment of the Utah State Prison into The Point. However, there are still pockets of significant population growth in downtown Salt Lake City and along the I-15 corridor, which will come from infill and targeted redevelopment. Additionally, there’s clear job growth in the industrial district near the airport and along major corridors.
I was surprised to see that roughly 40% of TAZs are expected to decrease in population over the next 30 years, but a quick look at the projected change in households shows that this is a function of decreasing household size (which is especially relevant in Utah). Population density change generally mirrors population change, but you can clearly see how the largest increases in density happen along existing corridors rather than underdeveloped land to the southwest (with the exception of Daybreak and The Point, both of which are master-planned communities).
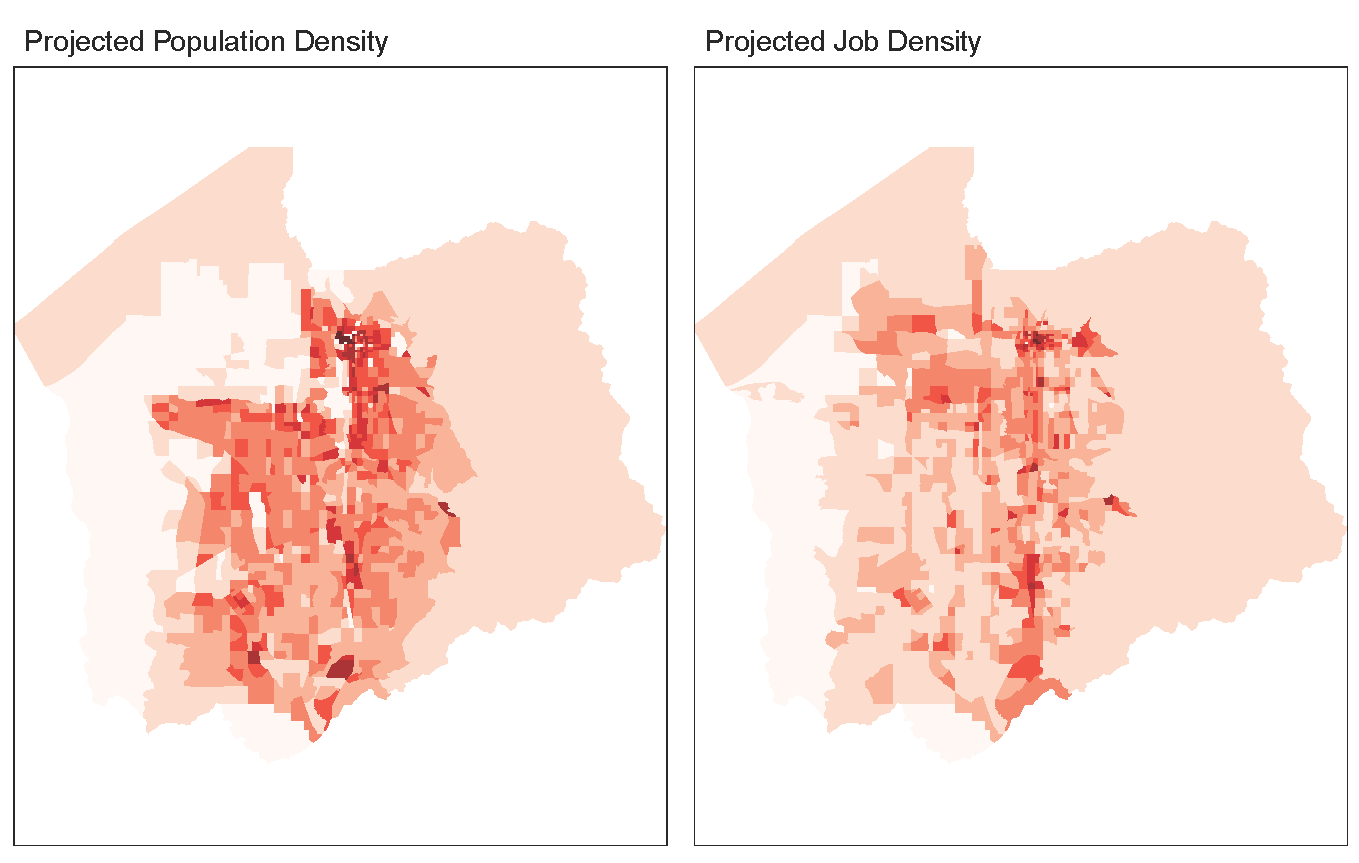
Incorporating growth:
After rasterizing, reclassifying, and rescaling the projections based on the methods described in the StoryMap, I was left with two rasters for projected population and job densities.
In the initial suitability analysis, existing population and job densities were each given a 30% weight and four demographic variables were given a 10% weight. Since I’m curious about long-term service needs – and to differentiate this analysis from the former – the projections are weighted more heavily than they might be otherwise. The final weighting scheme is 20% for projected population and job densities, 15% for existing population and job density, and 7.5% for the four demographic variables; existing transit access is given a -50% weight. The map below shows the most suitable areas accounting for transit access; other layers include the full suitability overlay and versions without transit access.
As we might expect, even more of southern Salt Lake County becomes suitable for transit (i.e., in the 90th percentile or higher) when projected population and job densities are incorporated into the analysis. However, this is only because existing access to transit is given a negative weight. Additionally, some already developed places like Rose Park or West Valley City would benefit from expanded service.
While the broad takeaway is that southern Salt Lake County will clearly need transit in the coming decades, the analysis also helps us see where this service should be targeted. This generally seems to track with existing development patterns. A neighborhood of single-family homes won’t change much in three decades compared to a neighborhood with a strong commercial corridor and moderate-density housing where infill development can happen more naturally.
Concluding thoughts:
Overall, I’m pleased with how this analysis turned out and I feel like it was a meaningful improvement on the initial project. I learned a few more tmap arguments, including how to add extra datapoints to polygon labels, and figured out how to set up a loop to generate and save maps based on a changing variable (e.g., population by year). It took longer to put together than I expected, but I’m realizing that the more code I write, the more code I can pull from when working on other projects.