
Estimating bicycling activity using Strava data
Earlier this year, I conducted exploratory research for a potential research grant to study the economic and health impacts of recreational bicycling in Utah. Unfortunately, the grant was put on hold as the funding agency’s priorities shifted, but it was a valuable learning experience.
Our proposed methodology had two main steps. First, we would estimate the amount of bicycling happening statewide using primary and secondary sources. Second, we would estimate the associated economic and health impacts using an input-output analysis tool and a World Health Organization tool, respectively. Naturally, this is easier said than done, especially when working with imperfect or incomplete data sources.
It’s rather tricky to determine how much bicycling happens across a state, especially when you need specific values for the impact tools. I started by querying commute mode data from the American Community Survey, which established a general baseline to validate other estimates against. Next, I examined daily travel diary data from the 2012 Utah Travel Study to estimate bicycling activity by trip purpose (e.g., non-home based non-work, home-based shopping, etc.). The Wasatch Front Regional Council provided access to the raw data, which included almost 100,000 trips taken by over 25,000 people.

The bulk of the analysis focused on Strava Metro data, which are aggregated, deidentified hourly trip counts reported by OpenStreetMap segment. Strava Metro has an extensive and useful dashboard to meet the needs of most users, but our needs required raw data - roughly 200 million records over five years. I used the DBI and RSQLite packages to link the SQL database to R so that the records could be summarized by OSM segment and month and spatially joined to a shapefile of OSM segments. The resulting objects (separated by year) were saved as .RData files to speed up subsequent processing.
Before going further, it’s necessary to understand a critical limitation of Strava Metro data. Trips are reported by OSM segment, and these segments are usually as short as a single block. A single bike ride (which we would typically refer to as a “trip”) would be counted across every segment on which it covers. Thus, ∑ trip count * segment doesn’t represent the number of traditional trips taken. We can visualize relative trip volume but we can’t report traditional trip counts for a specific geography or time frame. (The exception is traditional trips at the county and state level, which are reported on the Strava Metro dashboard by week, month, and year.)
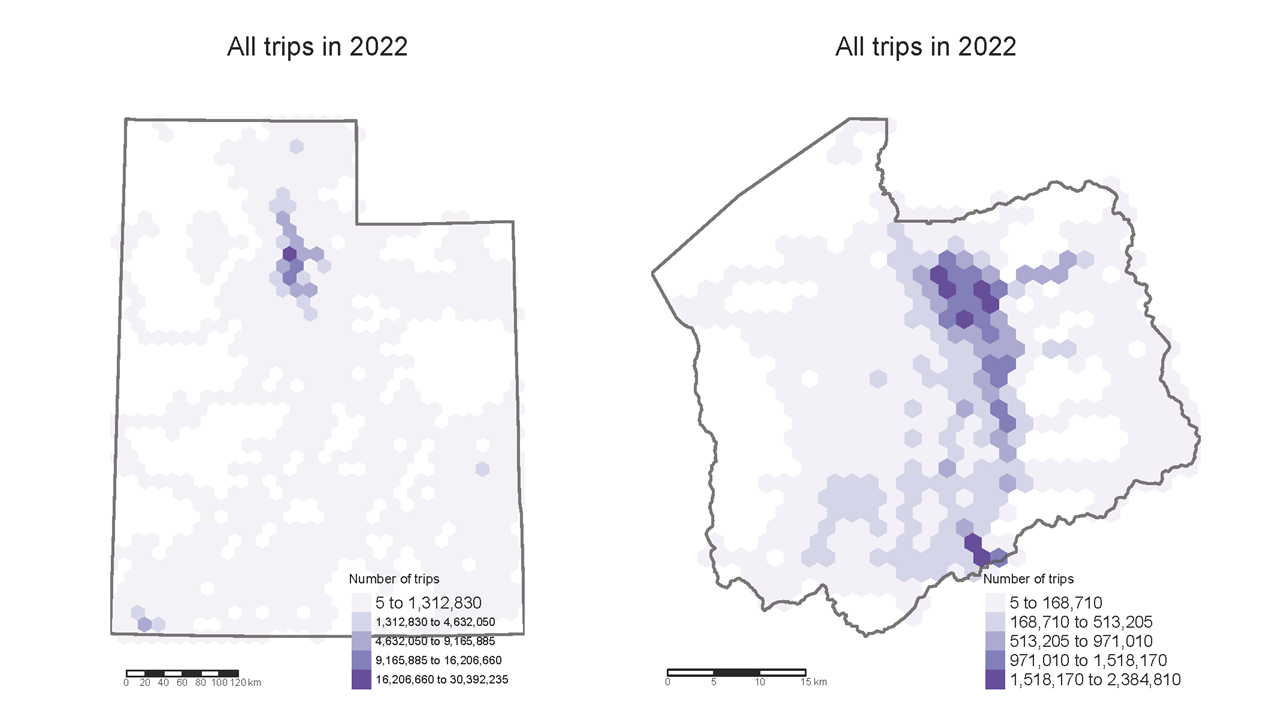
I started by visualizing last year’s activity patterns using a hexgrid to summarize trip counts. As you would expect, the majority of recorded trips took place along the Wasatch Front, with meaningful activity around St. George and Moab as well. In Salt Lake County, trips are concentrated in downtown Salt Lake City, the Foothills, and Corner Canyon - the latter two of which are especially popular for mountain biking. For those familiar with the region, you can see the five canyon roads, with Emigration Canyon being the most prominent (and most popular for road cyclists).
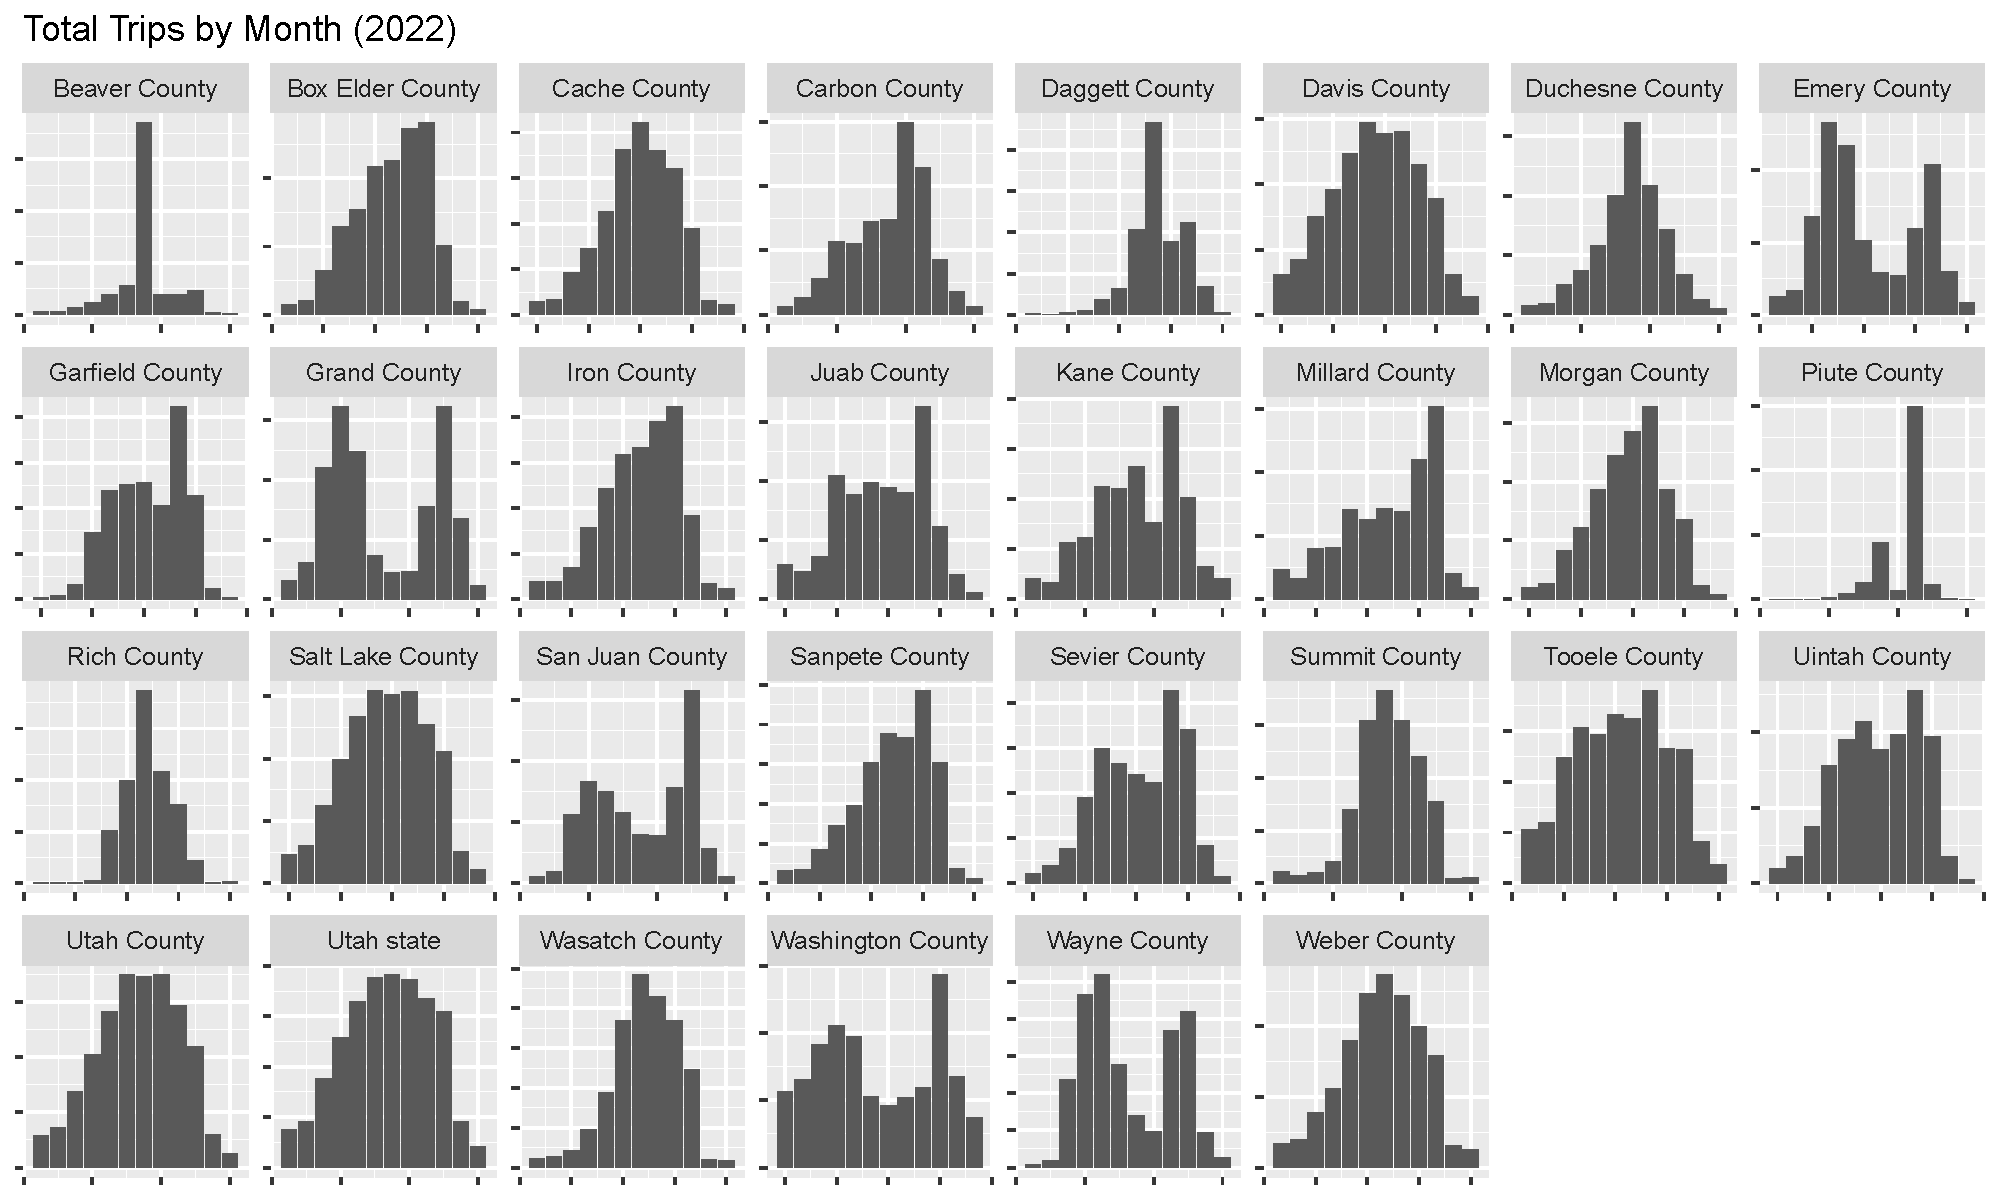
Next, I looked at monthly activity patterns by county (using unique trips from the dashboard). Most counties followed a unimodal distribution with an extended peak in the summer and very little activity in the winter. However, the seasonality of tourism and climate is clear in Grand and Washington counties, where the best time to ride is during the more temperate shoulder seasons.
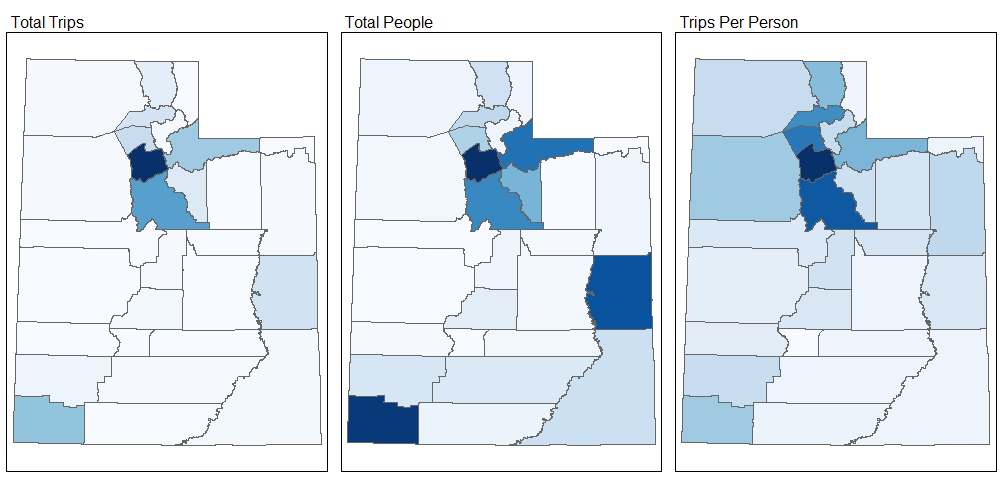
The difference between resident and tourist bicycling activity is especially clear when looking holistically at the three types of data that Strava reports: trips, people, and trips per person. Salt Lake has significantly more trips recorded than any other county in the state, but Grand and Washington have nearly as many unique people recording trips. Mountain biking hotspots like Moab and St. George attract countless visitors from around the state and country who only record a few rides, while Wasatch Front residents bike frequently throughout the year.
These patterns also speak to how people use Strava, which largely remains a platform for more serious athletes. Even if every Strava user records every trip they take, the data still doesn’t account for parents riding around the neighborhood with their kids or an elderly couple riding to the farmers market. This is where traditional methods of measuring bicycling activity come into play. Since trips are reported by extremely granular segments, it’s possible to correlate Strava trip data with bicycle counter data using the dashboard and Excel.
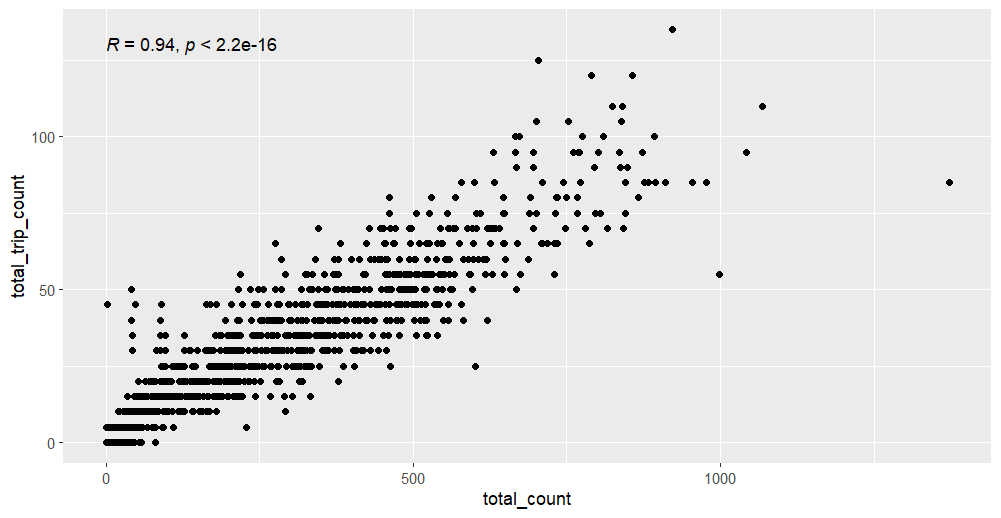
I used R instead, which did require using QGIS to identify the OSM segment ID for each counter location. Once I had a particular counter’s segment ID and the dates on which it was active, I isolated the daily Strava data associated with the counter and compared it to the actual counter data. This allowed me to answer two questions: What percentage of counter trips are recorded on Strava? How strongly related are Strava trips and counter trips?
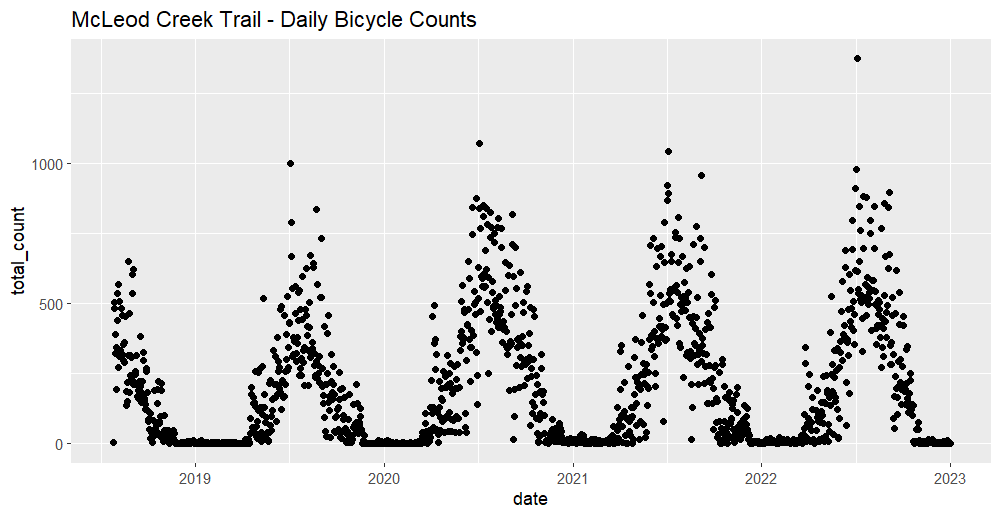
Park City, for example, has daily counts from 2018 to 2022 for a bicycle counter along the McLeod Creek Trail (depicted above). The counter reported over 300,000 trips over a five-year period, with reported Strava trips accounting for roughly 12% of those trips. A Pearson’s correlation coefficient of 0.94 (P = 0.000) indicates a very strong relationship between the two sources.
I completed this analysis for about 15 counters along the Wasatch Front and found varying R-values and Strava trip percentages depending on the type of trail (e.g., urban bike lane vs. rail trail vs. mountain bike trail). Unfortunately, our research was put on hold as we prepared to estimate bicycling activity across the state. If we had continued on, we would have used the analysis to define what Strava refers to as “expansion factors,” which could be used to estimate activity across a network.
In other words, if there is a statistically significant positive relationship between data sources and you know what percentage of actual trips are captured on Strava, you can extrapolate across a larger geography. Returning to the Park City example, Strava trips represented approximately 10% of counter trips. If we assume this relationship holds constant across the county, then the ~160,000 Strava trips recorded in Summit County last year represent 1.6 million actual trips. It’s an imperfect but defensible method, and the estimates can be validated against household travel survey data and other data sources as well.
Even though the grant didn’t work out, the experience I gained was invaluable. While my PI was instrumental in guiding the overall direction of the research, I was fully responsible for the analysis itself. I learned how to think multiple steps ahead to proactively troubleshoot and extended my knowledge of the tidyverse, sf, and tmap packages.